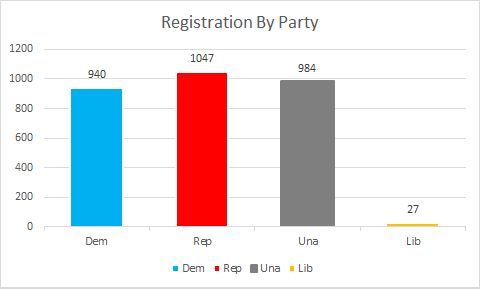
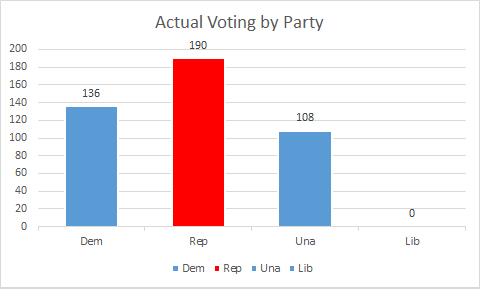
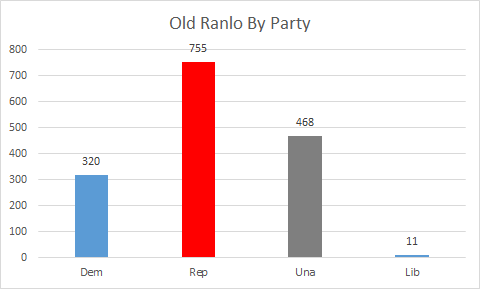
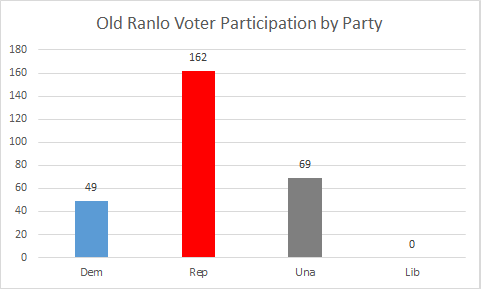
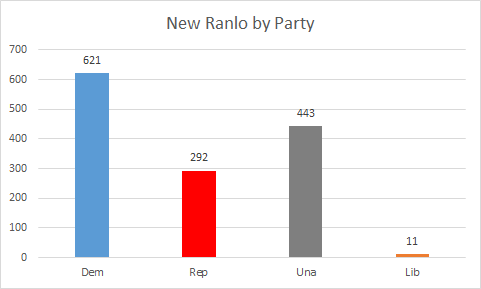
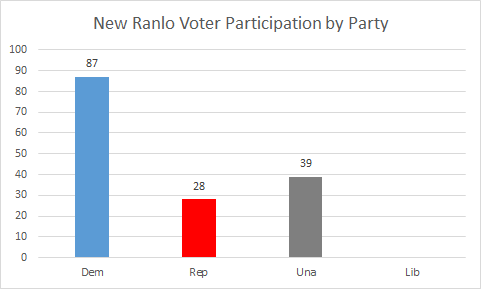
When you look at who voted: 31.34% of voters were Democrats, 43.78% of voters were Republicans, and 24.88% of voters were Unaffiliated (No Libertarians voted)
The actual number of voters are in the pie charts.
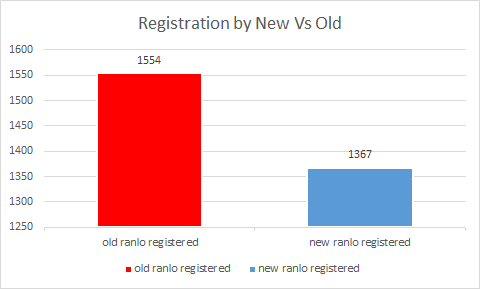
Number of registered voters is close. “Old” Ranlo makes up 53.2% of registered voters and “New” Ranlo makes up 46.8% of the registered voters.
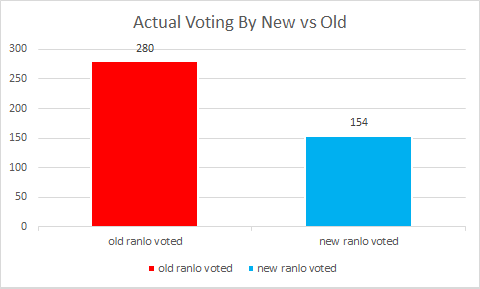
When looking at the voter turnout there is a stark difference. “Old” Ranlo made up 64.5% of the people voted and “New” Ranlo was only 35.5% of the actual voters.
I’ll be diving in to these numbers further in the future to see what if any conclusions I can draw from them. One of the things I found so far that is interesting is that the number of votes in the Mayor’s race break down almost exactly to party lines if you assume that the independent voters split evenly between the candidates. The total would have been 244 for Lynn Black and 190 for Robin Conner. The actual votes broke down to 245-181 in favor of Lynn Black
